
Lost items can hurt your business. When items are missing in your store, you lose investment dollars and then spend more money to replace them.
While you can address each loss individually, grouping losses by a location or department may expose larger trends. For example, you may find that losses are concentrated in certain areas of your store.
The PaladinNsight™ Loss Experience Tool offers this larger perspective along with the lost item details.
The tool informs you about losses in three different ways:
- Meter: Shows the total cost of lost items in investment dollars
- Viewer: Summarizes the financial impact of lost items by department or location
- Details: Gives details about the lost items in a department or location
- Investigating lost items is worth your time
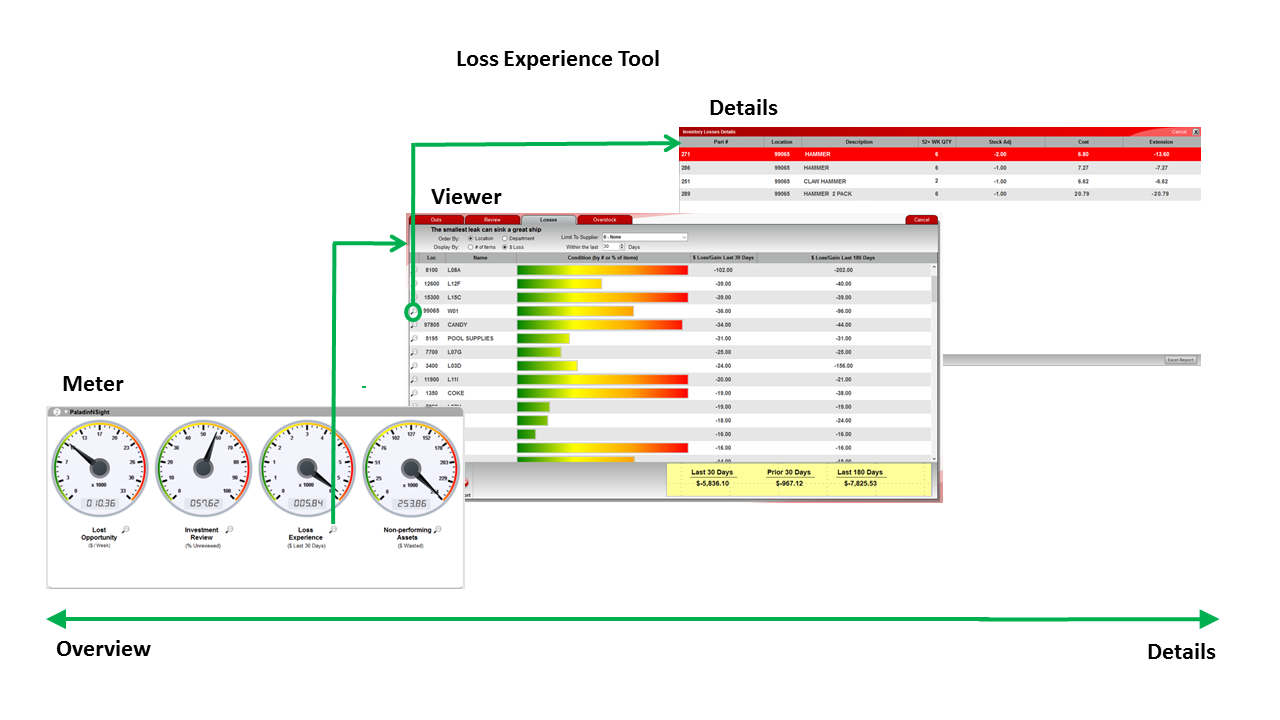
Figure 1: The Loss Experience Tool – A ballpark view
The Loss Experience Tool is in Paladin’s Inventory module on the Inventory tab. It is available to managers and designated employees.
This tool requires accurate stock-on-hand (SOH) values. SOH is recorded when you review inventory. To find out more about inventory reviews, read Take charge of your inventory investment with the Investment Review Tool.
Loss Experience Meter – A bird’s eye view
The Loss Experience Meter shows the total investment dollar loss from items that disappeared in the last 30 days.
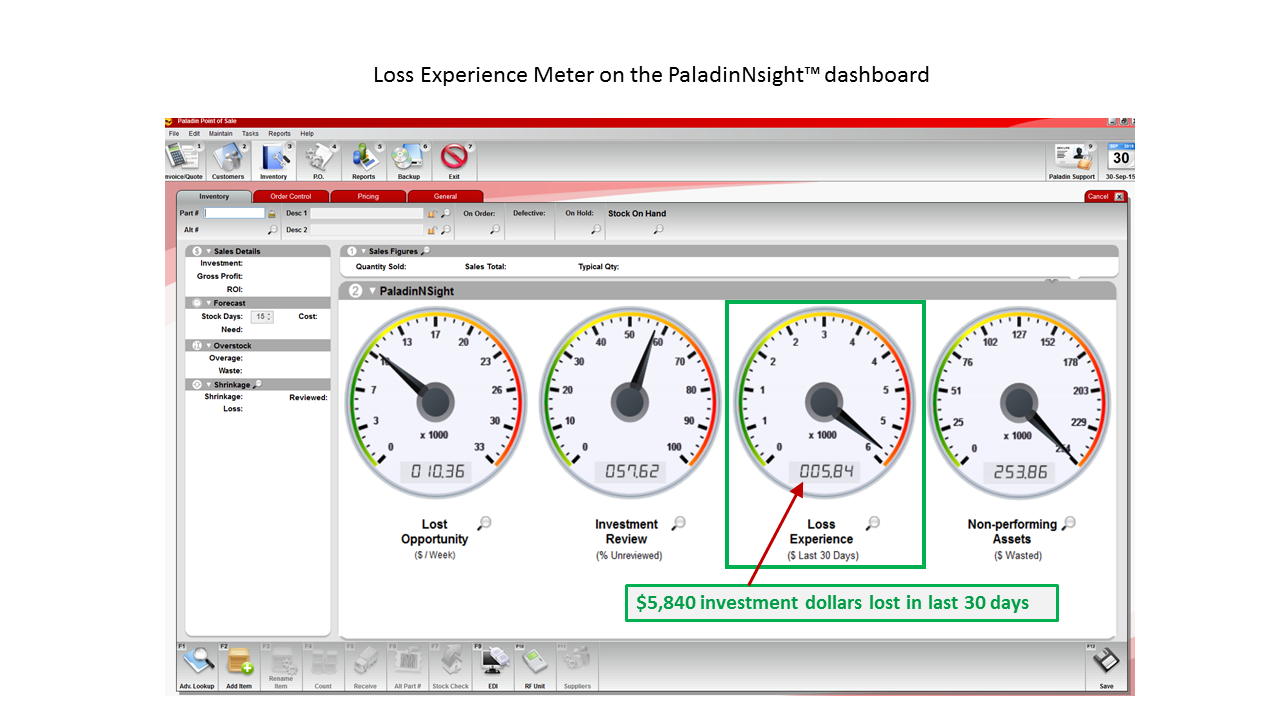
Figure 2: Loss Experience Meter on the PaladinNsight™ dashboard
Monitor this meter for unexpected changes. A sudden increase in your investment dollar loss may require an investigation.
Loss Experience Viewer – Catching larger trends
The Loss Experience Viewer shows losses by department or location. Click the magnifying glass to open it.
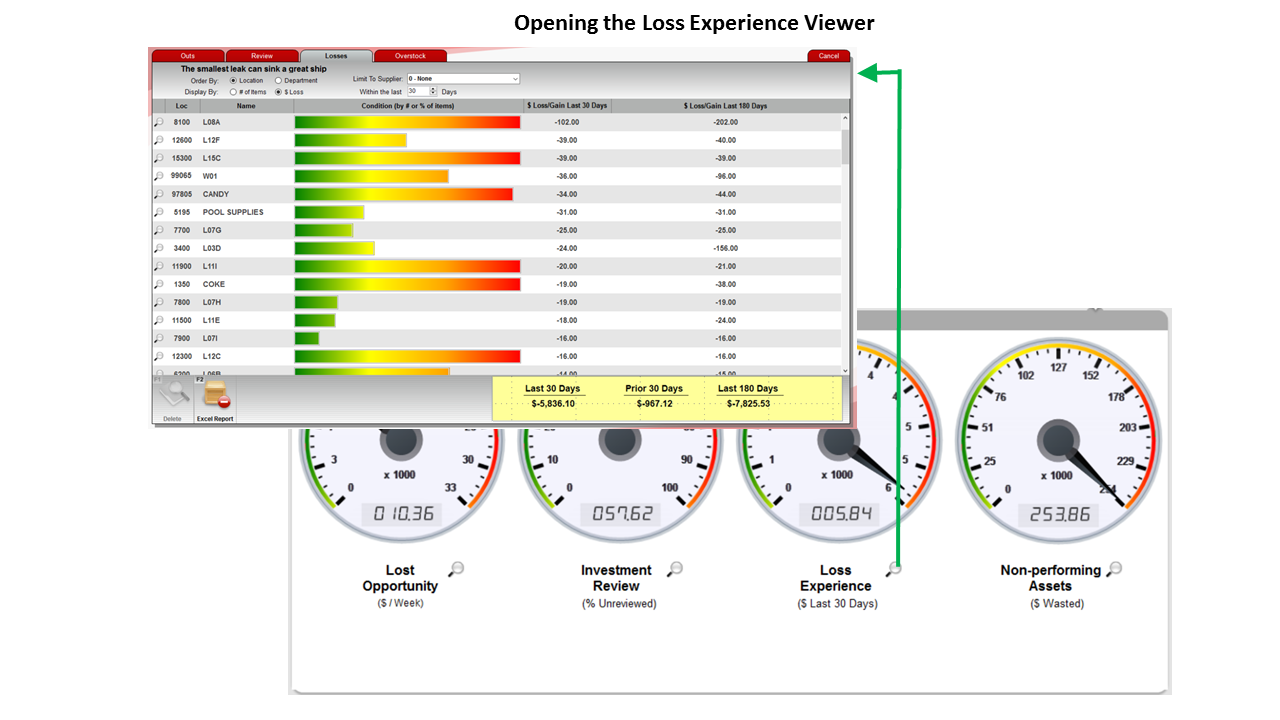
Figure 3: Opened Loss Experience Viewer
The interactive list shows you where your losses are occurring. You can set the time period and sort the list by investment dollars lost and other options.

Figure 4: Overview of Loss Experience Viewer
Use the following options to customize your view:
| View option | Values | Description |
| Order By |
|
Shows losses by location or department. |
| Display By |
|
Shows losses as a number of items or investment $ loss. |
| Within the last __ Days | Number of days backward in time [default: 30] | Shows losses for the specified time. |
| Limit to Supplier | List of suppliers [default: 0-None] | Shows losses for the selected supplier only. |
| Sort by column values | N/A | Click any column title to sort the list by those column values. |
To open this data in Excel, click the Excel Report button. (Microsoft 2007 or later is required.)
Tip: Investigate the departments or locations that are losing the most money first. To display them at the top of the list, follow these steps:
- In the Order By: options, select $Loss.
- Click the column title $Loss/Gain Last 30 days until the the largest dollar loss appears on top.
Loss Experience Details – An item-by-item account of your losses
To see the lost item details for a location or department, click the magnifying glass to open the Loss Experience Details view.
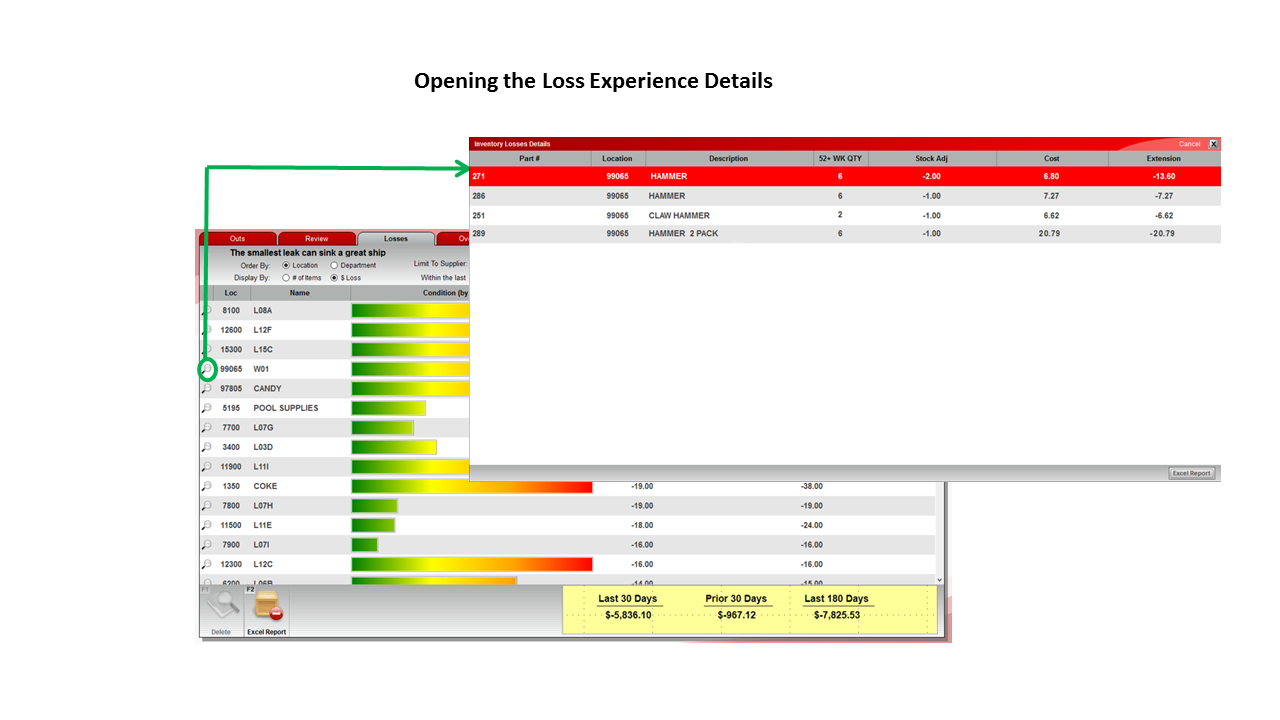
Figure 5: Opening Loss Experience details
Use these details to investigate lost items or to identify trends.
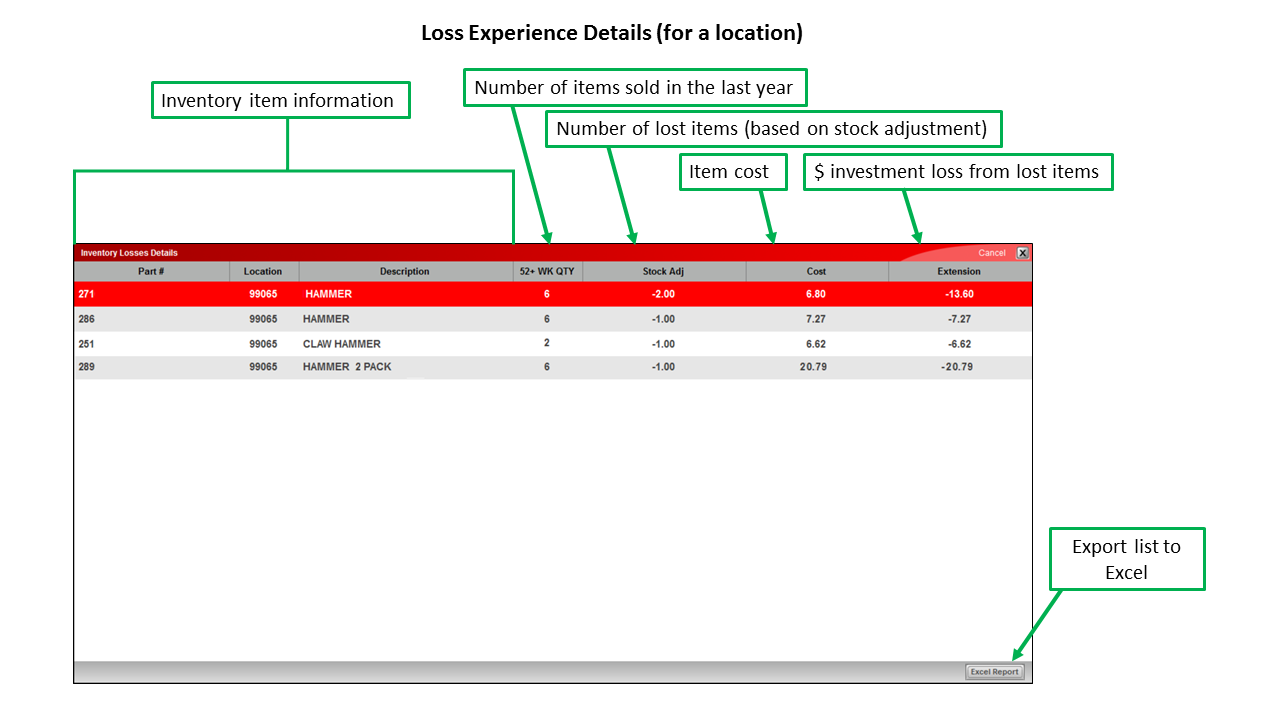
Figure 6: Loss Experience details
To open this list in Excel, click the Excel Report button. You can print or save the lost item list. (Microsoft 2007 or later is required.)
Investigating lost items is worth your time
There are many reasons that items disappear, including misplaced inventory, incorrect SOH counts, and theft. These losses hurt your business. When you use the Loss Experience Tool regularly, you minimize the financial impact and increase your awareness of lost items.
If you have questions or suggestions about this information, contact support@paladinpos.com.